For Russian investors, real estate is first and foremost a tangible asset: there is a property, a tenant, a contract, and a clear monthly payment. This creates a sense of control: the property can be “touched,” and the tenant can be spoken to. Exchange-traded instruments, by contrast, are often perceived as an abstraction of tickers and charts, where “prices jump around on their own.” Both perceptions are not entirely accurate: investing in “bricks and mortar” involves complexities and risks that are rarely considered at the time of purchase – while exchange prices, in addition to investor emotions, also reflect real economic processes.
Take a typical example of a turnkey income-producing property listed for sale: area – 1150 m², purchase price – 100 million rubles, monthly rental income – 883 thousand rubles, stated payback period – 9.4 years, return – 10.5% per year, indexation – 5% per year, tenants from familiar sectors: retail and medical services. In the investor’s mind, all of this forms a simple picture: buy it – and “the money keeps coming in.”

However, before investing money, it would be useful to clarify a number of questions for yourself:
-
Is 100 million rubles a fair price for this property? Why not 50 million and not 200? How should it actually be determined and verified correctly?
-
10.5% per year – what does that actually mean? Before or after taxes? What other expenses will I face?
-
How often and for how long will vacancies arise between tenants? Will investments in renovation and redesign be required when the business profile changes?
-
What commission will the agency charge when buying and selling the property?
Annual rent indexation of 5% with an average inflation rate of 7.7% (from 2006 through 2025 inclusive) means that in real terms, the cash flow loses about 2.7% a year.
And in order to simply get your money back when selling the property in 10 years, you will need to receive not 100, but 210 million – without accounting for additional investments. Whether the property can be sold for that amount, and how quickly, remains an open question.
In addition, historically the ruble depreciates against global reserve currencies by an average of 5–8% per year.
How will all of the above affect the property’s final return?
Physical real estate is revalued infrequently. In comparative reports, prices move in “steps,” valuations rely on past data and may lag behind real demand. Hence the false sense of stability.
Investing in real estate without buying property
To earn income from real estate, it is not necessary to buy an entire property for tens of millions and personally deal with renovation, leasing, and sale. There are collective investment instruments: units of closed-end real estate mutual funds (ZPIFn) in Russia and real estate investment trusts (REITs) abroad, shares and bonds of developers and management companies, manufacturers of construction materials and other businesses related to the real estate market, crowdlending platforms, credit cooperatives, and so on.
In most cases, the essence is the same: a property is built or acquired in shared ownership using investors’ funds, and brought into proper condition for subsequent leasing or resale. What differs is the legal structure: the level of regulation, reporting transparency, liquidity, how investors receive income, and risk allocation.
I will write separately about Russian “paper” real estate (ZPIFn, cooperatives, crowdlending) and real estate investment trusts outside the US. This article will focus on American public REITs, accessible to private investors through a brokerage account.
How REITs work: a company, not an “flat on the exchange”
Real estate investment trusts are shares in companies operating under a special tax regime. Their shares trade on the exchange like ordinary securities.
To preserve tax benefits, a REIT must meet a number of requirements: a significant portion of its assets and income must be related to real estate. The key condition is the distribution of at least 90% of taxable income to shareholders in the form of dividends.
An investor’s return consists of two components: regular distributions of part of operating profit and the difference between the purchase and sale prices of shares. At the same time, a private investor does not receive stakes in specific buildings or claims to rental payments – management of the property portfolio remains the company’s responsibility.
As with any exchange-traded instrument, REITs are characterized by daily market revaluation: share prices reflect expectations regarding rent, vacancy, rates, leverage, management quality, and macroeconomic conditions. This provides transparency, but is emotionally harder because of volatility, especially during crisis periods.
Being publicly listed means higher disclosure requirements: REITs register securities with the SEC and publish financial statements, data on asset structure, debt levels, dividend policy, and key risks. This gives the investor the opportunity to assess the portfolio, sources of financing, and profitability dynamics.
According to data from Nareit, the US public REIT market includes hundreds of companies with a total capitalization of more than one trillion dollars.
Equity and mortgage trusts
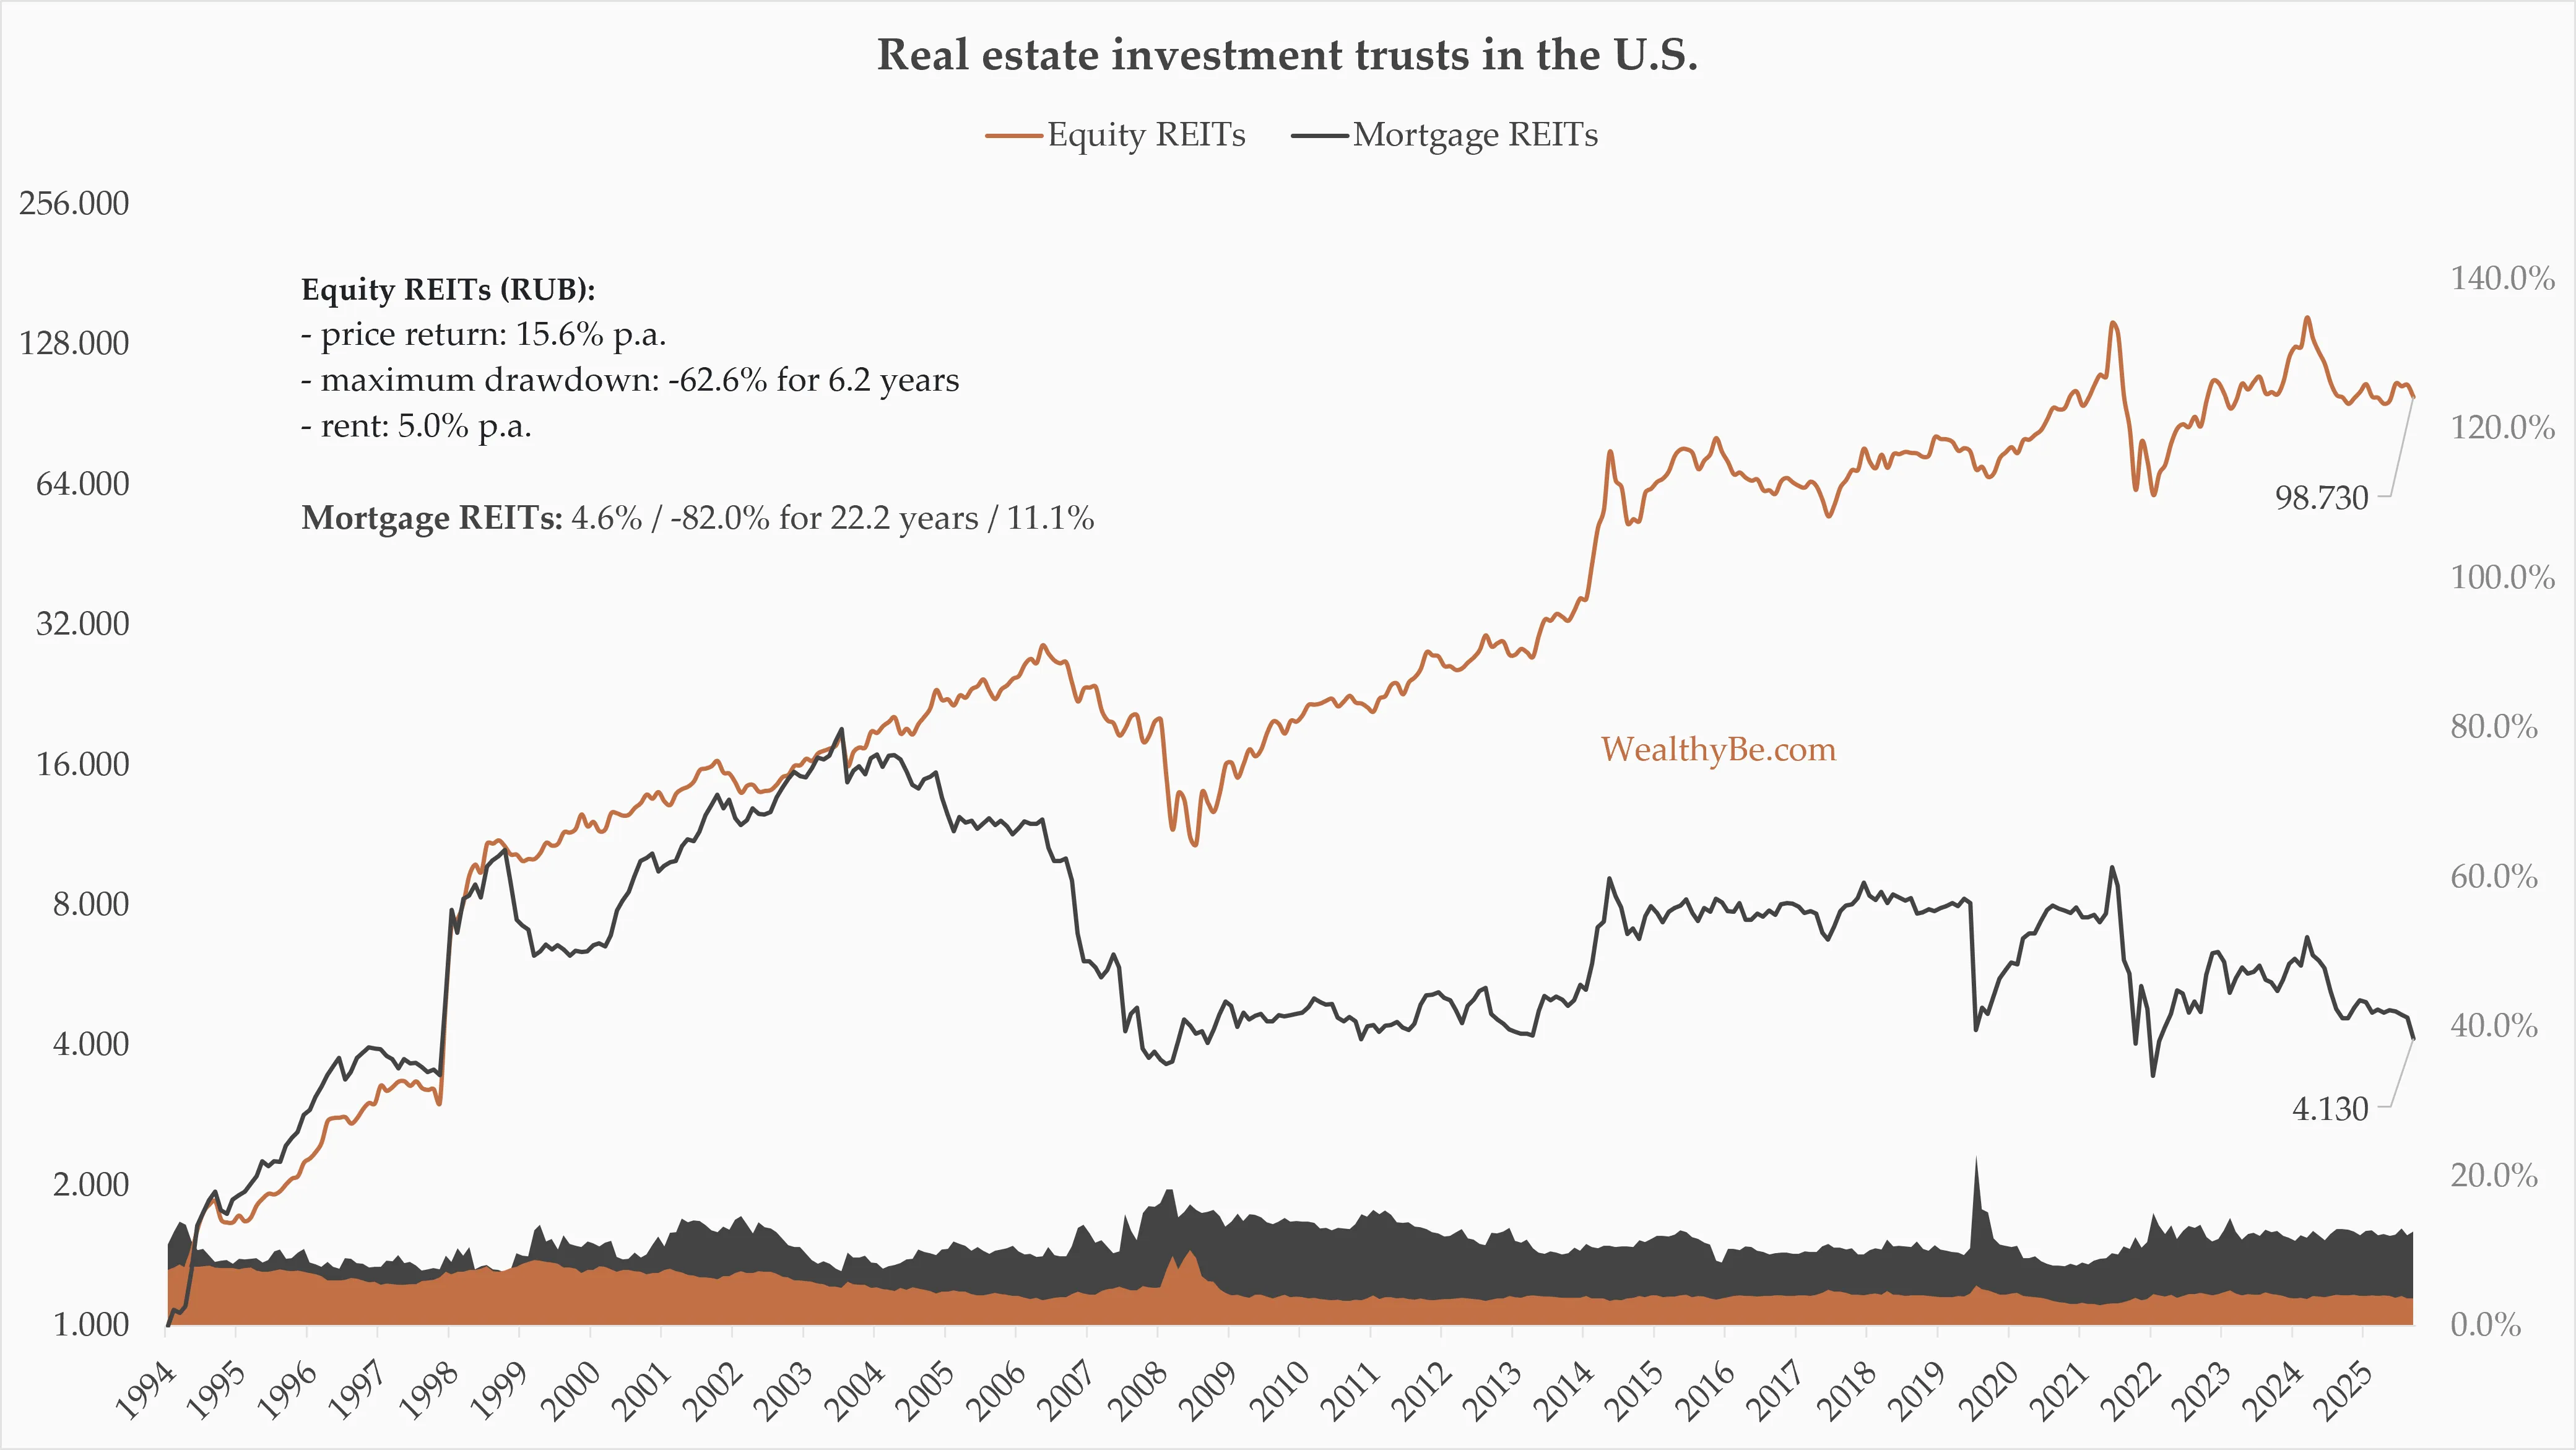
Within the broader asset class, there are two fundamentally different business models: equity REITs and mortgage REITs.
The former own real estate properties (warehouses, data centers, residential complexes, shopping centers, hotels, and so on) and generate income through rental payments and appreciation of the portfolio’s value. Their financial results, as in the case of “bricks and mortar,” are determined by property location, occupancy levels, rent dynamics, operating expenses, capital expenditures, and sector trends (for example, the development of e-commerce or the transformation of office demand).
Mortgage REITs manage residential and commercial mortgage portfolios, including securities – RMBS and CMBS. Their profit is the difference between asset yields and the cost of borrowed financing. Leverage is often used. The return of mortgage trusts depends on the level and structure of interest rates, spreads, and the dynamics of mortgage prepayments.
A mortgage trust operates “somewhat like a bank”: it raises funds at one rate and places them at a higher one: income ≈ rate spread x leverage. As investors, we receive a stake in a credit business with all the accompanying risks.
The dividend yield of mortgage REITs is usually noticeably higher, which makes them attractive to some investors. Their price dynamics, however, are often negative, while total return is lower than that of equity trusts. For an investor, it is fundamentally important to distinguish between these models.
Equity REITs: from warehouses to casinos
The US market for public equity trusts goes far beyond the familiar idea of real estate (apartments, offices, shopping centers). Here is how Nareit classifies it.
| Sector | Description, growth drivers, and risks | Price return | Drawdown | Dividend yield |
|---|---|---|---|---|
| Industrial | Leasing warehouses and logistics space for e‑com, goods distribution, and manufacturing. Drivers: growth of e‑com, restructuring of supply chains, demand for fast delivery. Risks: warehouse oversupply, slowdown in e‑com/manufacturing, cyclical demand. | 10.3% per year | -82.6 on 8.1 years | 3.0% per year |
| Office | Leasing office space. Drivers: office occupancy, flexibility of work format (remote/hybrid), location. Risks: sensitivity to cycles, remote work, rising vacancy, high costs of repurposing. | -4.7% per year | -66.9% over 7.5 years | 4.1% per year |
| Shopping centers | Leasing space for retail trade in everyday goods and services. Drivers: local consumption, foot traffic, balanced tenant mix. Risks: store closures, growth of e‑com, dependence on anchor tenants. | -0.1% per year | -69.2% over 7.7 years | 4.6% per year |
| Regional malls | Leasing space, income from redevelopment. Drivers: consumer spending, entertainment services, successful redevelopment. Risks: shift toward online retail, bankruptcy of anchor tenants, high CAPEX, drawdowns during crises. | -0.3% per year | -78.9% over 8.3 years | 5.6% per year |
| Free standing retail | Long-term leasing to one major tenant (pharmacy, restaurant, gas station, etc.). What’s important: tenant credit quality, contract terms, rent indexation. Risks: dependence on one tenant, risk of default/brand exit, sensitivity to key rate dynamics. | 1.6% per year | -50.7% over 4.3 years | 4.9% per year |
| Apartments | Leasing residential units in multi-family buildings. Drivers: employment and demographics (migration, population growth), housing affordability, rental legislation. Risks: oversupply, rent regulation, dependence on credit availability and real household incomes. | 1.8% per year | -60.5% over 4.5 years | 3.5% per year |
| Manufactured homes | Leasing land plots and community infrastructure for modular homes. Drivers: development of affordable housing, low mobility of residents, demographic trends. Risks: regulation, local land-use conflicts, limited rent growth. | 6.3% per year | -57.0% over 9.1 years | 2.6% per year |
| Single-family homes | Leasing houses in suburbs and small towns. Drivers: trend toward moving out of cities, home purchase affordability, demographic growth. Risks: complexity of managing many small properties, repair costs, cyclicality of the residential real estate market. | 6.2% per year | -52.8% over 4.3 years | 2.3% per year |
| Diversified trusts | Leasing different types of properties within one trust. What’s important: overall economic dynamics, balanced mix of sectors. Risks: mixed portfolio structure, high variability of results depending on the economic cycle. | -3.8% per year | -63.8% over 7.2 years | 5.6% per year |
| Lodging and resorts | Income from accommodation and additional services in hotels, resorts, and recreational real estate. Drivers: tourism, business travel, household income, state of air travel. Risks: high cyclicality (deep declines during crises, e.g. 2008, 2020), dependence on macroeconomic and epidemiological shocks. | 1.1% per year | -80.4% over 7.2 years | 4.6% per year |
| Healthcare | Leasing premises for medical institutions and nursing homes (including with linkage to tenant KPIs). Drivers: aging population, demand for medical services, insurance/reimbursement system. Risks: regulation, dependence on government support and tenants’ financial position. | 3.9% per year | -57.1% over 6.9 years | 4.8% per year |
| Self-storage | Leasing small boxes for individual storage (to individuals and businesses). Drivers: urban density, population mobility, demand for additional space, flexible pricing. Risk: oversupply in certain areas. | 3.8% per year | -55.4% over 4.6 years | 3.7% per year |
| Timberland | Sale of timber and processed products under long-term contracts with pulp-and-paper and wood-processing enterprises. Drivers: construction activity, commodity prices, export demand. Risks: cyclicality of commodity markets, fires, and weather factors. | -0.9% per year | -59.1% over 4.3 years | 3.6% per year |
| Telecommunications | Long-term leasing of communications infrastructure (cell towers, masts, fiber optics) to operators. Drivers: growth in mobile traffic, investment in networks, development of 5G. Risks: concentration on large operators, technological shifts. | 4.4% per year | -52.7% over 4.3 years | 2.9% per year |
| Data centers | Leasing cloud infrastructure and server colocation for corporations. Drivers: development of cloud services and AI, availability of electricity. Risks: high CAPEX and energy consumption, technological obsolescence, sensitivity to the key rate. | 10.9% per year | -57.6% over 1.9 years | 2.5% per year |
| Gaming | Long-term leasing of real estate for casinos and entertainment complexes (often in triple‑net format: operators pay taxes, insurance, and maintenance). Drivers: leisure spending, financial stability of operators, regulatory environment. Risks: concentration on several operators, cyclical demand, regulatory restrictions in gambling. | -10% per year | -41.3% over 1.5 years | 5.8% per year |
| Specialty | Rental income from non-standard properties (cinemas, farms, billboards, etc.). Drivers: depend on the specific business model. Risks: individual analysis is required for each type of asset. | 8.2% per year | -51.8% over 4.5 years | 5.5% per year |
Note:
-
The average geometric price return (excluding rent) in rubles over the past 10 years is shown
-
The maximum drawdown is shown for the entire available period for each sector – in most cases since September 1994, and for individual sectors over a shorter time interval
-
The amount of rent in percentage terms does not depend on the currency at the time of receipt (it is the same for rubles and US dollars), but over the long run rent in a strong currency turns out to be more beneficial because of ruble depreciation
-
Statistics for the gaming business sector are available only since June 2023
-
The data are based on sector indices: individual real estate investment trusts may show results better or worse than the broad market in different periods
-
The values shown do not account for fees, taxes, or inflation
As can be seen, sectors differ substantially in their sensitivity to rates, economic cycles, and technologies: under the general concept of “real estate” lie heterogeneous risks and dynamics. This is especially visible in a crisis.
Mortgage trusts: money made on the rate spread
Mortgage REITs attract dividend investors with double-digit yields and regular payments, but in essence they are specialized credit structures: their profit is formed from the spread between the yield of mortgage assets and the cost of borrowed capital, amplified through high leverage.
Nareit distinguishes two main segments of mortgage trusts: residential and commercial financing. The business models are similar. The difference appears in the composition of underlying assets and the structure of risks.
| Sector | Description, growth drivers, and risks | Return | Drawdown | Rent |
|---|---|---|---|---|
| Residential financing | Purchase and structuring of residential mortgage loans and RMBS (often agency-backed with a government guarantee), financing through REPO/credit lines, earning on the spread between portfolio yield and borrowing costs. What’s important: the interest rate curve, spreads between agency and non-agency MBS, prepayment speed (refinancing when rates fall), availability and cost of REPO financing. Risks: sensitivity to rates and leverage – sharp changes in yields/spreads lead to capital revaluation and dividend cuts. | -6.9% per year | -85.3% over 22.2 years | 12.0% per year |
| Commercial financing | Origination and purchase of commercial mortgage loans (secured by offices, shopping centers, warehouses, hotels, etc.) and CMBS, income from higher lending rates and fees, often with less leverage than in the agency residential segment. What’s important: borrowers’ credit risk and CRE segment conditions; CMBS market liquidity; borrowers’ compliance with covenants; ability to refinance properties; overall cost of funding. Risks: in stress periods (2008, COVID-19), deeper drawdowns and losses – which is why the initial yield is higher. | -5.2% per year | -95.8% over 22.2 years | 9.2% per year |
The relatively higher dividend yield of mortgage trusts is not a “gift from the market,” but compensation for a set of risks: interest rate, credit, operational (including those related to managing leverage and hedges), and liquidity risk. Despite the attractiveness of the rental-income flow, in terms of total return mortgage trusts significantly lag equity REITs, their volatility is higher, and drawdowns last longer.
In essence, investing in mortgage trusts is not a bet on real estate as such, but on management’s competence in managing a credit portfolio under changing monetary policy conditions. In terms of risk structure, this segment is closer to a specialized financial business, something between a bank and a mortgage securities fund. It is hard to classify such trusts as defensive assets.
What the data suggests
The US public REIT market dates back to the 1970s, with more than half a century of data. This allows exchange-traded real estate to be considered an established asset class with measurable returns and drawdowns.
The total return of equity trusts is comparable to equities, but they follow the same macro cycles: the inflation of the 1970s, the dot-com crash in 2001, the mortgage crisis of 2008, the pandemic, and rising rates in 2022–2023.
At the same time, sectors demonstrated different resilience: data centers and warehouse real estate went through crises with smaller losses, while offices, shopping centers, hotels, and resorts experienced deeper drawdowns and recovered more slowly.
Such transparency is not a drawback of REITs. It makes it possible to assess typical drawdown magnitudes and compare them with the expected return of a particular segment.
One should not think that crises are exclusively exchange-market phenomena. The illusion of stability in physical property disappears at the first attempt to sell an asset in the midst of a crisis: liquidity disappears, discounts grow, transactions fall through. Rental income can suffer in both cases. The only difference is that on the exchange, revaluation takes place daily.
The role of REITs in an investor’s portfolio
Unlike a single property or a concentrated portfolio of income-producing real estate, REITs provide transparent reporting, liquidity, diversification by currencies, countries, and many properties. Historically, trusts have improved portfolio characteristics, but they have also demonstrated the nature of a risky asset: deep drawdowns and cyclical dynamics comparable to equities.
-
REITs are appropriate as a component of a balanced portfolio with stocks and bonds if additional current income and diversification are required. Or when priority is given to liquidity rather than direct property management. Units of real estate investment trusts can also be bought not for rent, but simply as a security with an understandable and familiar underlying asset – not “processing plasma into powder for 3D printing,” but a good old shopping center or warehouse.
-
At the same time, REITs may not be suitable if you perceive them as a risk-free source of passive income, or if you already own physical real estate in the same region or sector.
Before including trusts in a portfolio, it is advisable to assess the key parameters:
-
whether the currency of investments matches the currency of future goals and expenses
-
taxation of dividends, including the risk of double taxation
-
the share of capital that may reasonably be allocated to real estate – both physical and exchange-traded
-
as well as tolerance for historical drawdowns
If the answers are satisfactory, a REIT may become a functional element in the capital structure, based on the instrument’s actual characteristics rather than marketing expectations.
Vladimir Vereshchak — investment advisor
How I work →
Email ·
Telegram ·
LinkedIn ↗